Exploring Costs and Usage
This section will walk you through the process of exploring costs and usage using CAU Explorer.
Charts
Charts are displayed in the upper section of the CAU Explorer, and provide visual representations of costs and usage patterns for the selected dates, and filters.
By exploring chart data, a visual review of a chart might rapidly indicate an anomaly or periodic usage trend.
For example, displaying daily data grouped by resource types might show that there are certain days each week that a bar on the chart is comparatively higher than its neighboring bars, showing a peak in cost and usage for a certain resource type on a particular day of the week. This pattern might reflect a known weekly usage-intensive activity.
Structure
The CAU Explorer charts have a standard structure:
X-axis: Time in summary units of days or months, according to the selected Granularity level.
Y-axis: Cost or Usage scale in units of the configured currency.
Data points: Hovering the mouse over a Time unit bar in the chart displays a pop-up detailing the individual Cost and Usage data points for each Group By item (if selected) of that time unit.
Legends
Legends provide an interpretation of elements in a chart.
The Y-axis is marked with currency unit steps indicating costs and usage levels, providing a visual comparison across time units.
The X-axis is marked with the time unit’s month or day beneath each bar in the chart.
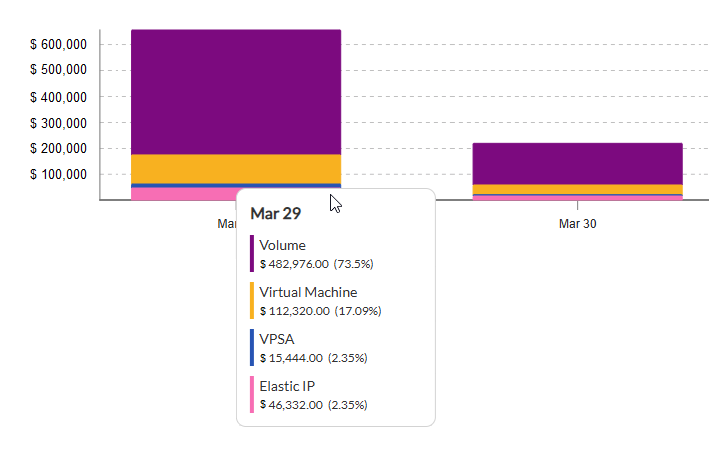
A chart with a Group By selection displays the proportion of each group’s summary cost and usage as a separate color in stacked bars.
A “data points” pop-up indicates the color used for each group item, names the group and displays its cost and usage in monetary value and percentage of the time unit’s total.
Currency
All costs and usages are displayed in the user’s invoice currency, as configured in Zadara’s billing system. In the event that costs in the CAU Explorer are not presented in the expected currency, please contact Zadara Support.
Tables
Tables are displayed in the lower section of the CAU Explorer.
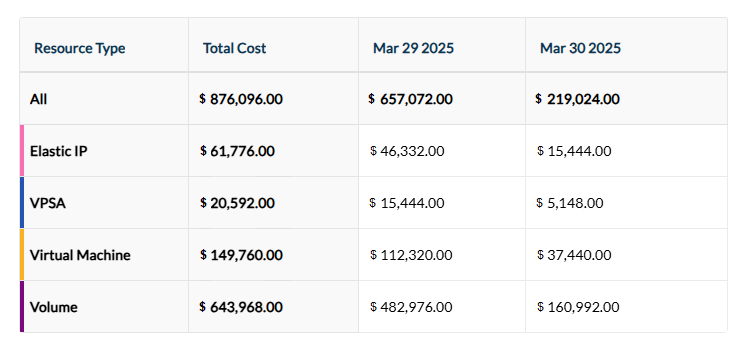
Tables show the same information as the charts, presented in a tabular monetary layout. Subtotals of filtered costs and usage are listed per time unit of the selected period, along with a grand total. If Group By is selected, a further subtotal breakdown is also displayed per group in each time unit, along with a grand total for all time units of the group.
Similar to the exploration of chart data, a visual review of a table might rapidly indicate an anomaly or periodic usage trend.
Using the same example, displaying daily data grouped by resource types might show that there are certain days each week that the cost and usage amounts are comparatively higher than neighboring columns, showing a peak in cost and usage for a certain resource type on a particular day of the week. This pattern might reflect a known weekly usage-intensive activity.
Data structure
The tables in CAU follow a standard data structure:
Rows: Represent individual cost or usage categories, for example, compute costs or storage costs.
Columns: Represent time periods, for example, daily or monthly costs.
Layout
The table layout is designed for clarity and ease of use.
Main view table layout
Each row represents a specific category, and each column represents a specific time period.
Below the heading of each column, the topmost row displays a total that is the sum of all rows below it in the same column.
If the Group By option is not selected, there is a single data row below the headings, and the leftmost column displays the sum of usages displayed in all other columns for the selected period.
If a Group By option is selected, the leftmost column lists a member of the selected Group per row, and the second column displays the sum of that row’s Group’s usage for the selected period.
Drill-down view
Use the drill-down view to explore the breakdown of costs that accumulate to a total or subtotal in the main view:
Click a cell in the top-level Main view table layout.
Click a bar in the Charts.
Note
If a Group By option is applied, both the main table and the chart reflect the grouped values for the selected time period:
The table displays one row per group value.
The chart shows stacked bars that illustrate the proportions of each group.
Click a table cell or a segment of a stacked bar to drill down to reveal the detailed breakdown for the selected group and time period.
You can also explore the associated usage information, indicating how the costs were derived.
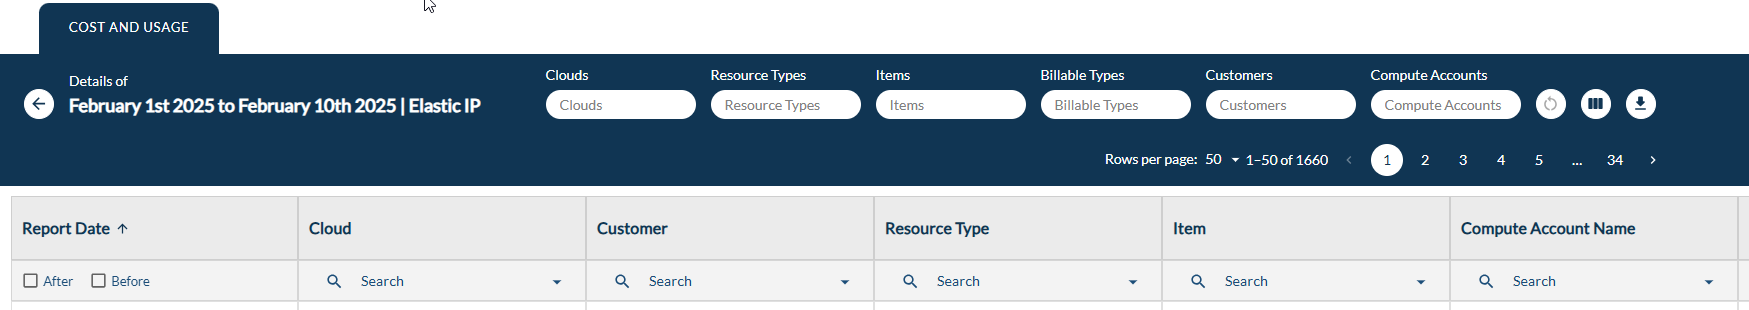
The drill-down view’s caption heading indicates the scope of the view, using the following convention:
Details of
<date range selection> | <Group By selection>
Note
Reverting back to top level main view resets the drill-down view’s custom settings to default.
Additional features in the detailed drill-down view further assist cost and usage exploration:
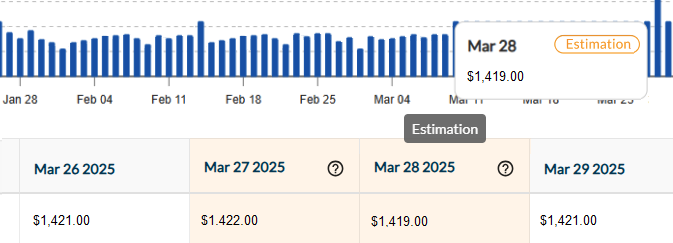
Estimation
Setting the number of rows to display
Under the filters in the top filters bar, open the Rows per page dropdown to select the number or rows to display.
Default: 50
Minimum: 5
Maximum: 100
Adding and removing columns from the view
Note
All columns are listed and described in Drill-down detail table columns.
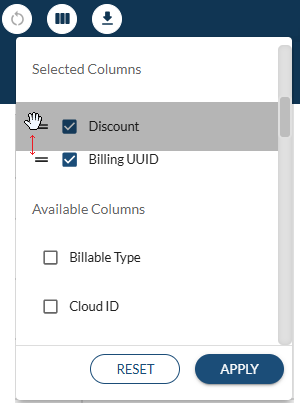
Click the Columns button to the right of the top filters bar. Depending on the selected Granularity level (Daily or Monthly) the dropdown that opens displays:
Selected Columns
Default columns are auto-selected for the drill-down detail table.Most default columns are relevant for both Granularity levels (Daily or Monthly).The default Quantity, Hours and Amount columns are specific to the selected Granularity level:Column Name
Both
Monthly Only
Daily Only
Report Date
✓
Cloud
✓
Customer
✓
Resource Type
✓
Item
✓
Compute Account Name
✓
Unit Price
✓
Discount
✓
Billing UUID
✓
Quantity MTD
✓
Hours MTD
✓
Net Amount MTD
✓
Daily Quantity
✓
Daily Hours
✓
Daily Gross Amount
✓
Daily Net Amount
✓
Uncheck columns to remove them from the display.
Available Columns
By default, many of the available columns are not displayed in the detail table.
To add a column to the display, mark it, and then in the Selected Column section, drag it up or down to the preferred location.
Column order
There are two ways to rearrange the column display sequence:
Columns filter:
Click the Columns button to the right of the top filters bar.
Drag one selected column at a time, up or down.
Detailed table:
In the detailed table view, click and hold the column header, and drag the column left or right.
Sorting the table data
To sort the table data according to the ascending or descending values of a selected column:
In the detailed table view, click a column header to display the table data sorted according to the sequence of the data in the selected column.
Searching and filtering column values
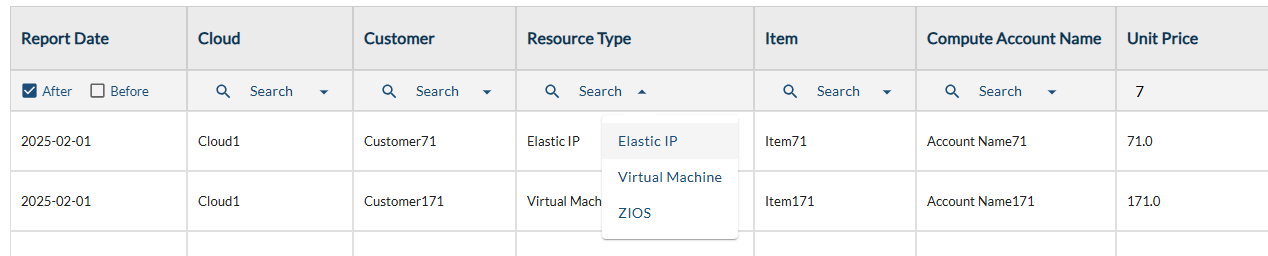
Date and timestamp type columns support filtering for entries After or Before a specified date and time, or between the two.
String and UUID type columns support filtering, by entering a partial match in the Search field below the column heading.
Numeric type columns are regarded as strings for the purpose of searching and filtering.
Download detailed drill-down view
The CAU Explorer supports downloading a detailed drill-down view as a
.csv file from the UI, or as either JSON or CSV output using the CLI.
.csv and JSON outputs contain all of the
Drill-down detail table columns.Note
UI: An alert appears, advising narrowing down the scope.
The number of rows in the current scope appears in the top filters bar below the Download button, after Rows per page.
CLI: The response returns an error, advising narrowing down the scope.
Download detailed drill-down view to CSV (UI)
The drill-down view Download CSV button is to the right of the top filters bar.
Click Download CSV to export the detailed drill-down view, and save it as a file in
.csvformat. The scope of the saved data is according to the selected time period, granularity, grouping and filters.The downloaded
.csvfile has the following naming convention:CAU_<organization>_<from yyyy-mm-dd>-<to yyyy-mm-dd>_<daily/monthly>_<detail/aggregated>.csvDownload detailed drill-down view to JSON or CSV (CLI)
From the command line, you can use the Provisioning Portal’s GET Organization API to download CAU Explorer detailed drill-down data in either JSON (default) or CSV format, and apply a custom time period, granularity, sorting and other optional filters.
Usage:
curl -X GET "https://<Zadara Provisioning Portal URL>/api/v2/organizations/<Organization UUID>/cost_explorer/details.json" \
   -H "accept: application/json" \
   -H "X-Token: <token>" \
   --get --data-urlencode "granularity=<monthly/daily>" \
         --data-urlencode "from=<start date>" \
         --data-urlencode "to=<end date>" \
         --data-urlencode "<optional parameter1>" \
         --data-urlencode "<optional parameter2>"
Parameters
The
GET OrganizationAPI supports the following parameters:Parameter
Type
Description
Mandatory
granularitystring
Granularity level
Valid values:
monthly(default)daily
✓
fromdate
Report start date in yyyy-mm-dd format
✓
todate
Report end date in yyyy-mm-dd format
✓
cloudarray of strings
Filter by cloud ID
resource_typearray of strings
Filter by resource type
itemarray of strings
Filter by item
billable_typearray of strings
Filter by billable type
userarray of strings
Filter by user
compute_account_namearray of strings
Filter by compute account
sort_bystring
Name of column to sort by
sort_directionstring
Order order of sorted values
Valid values:
asc(default)desc
download_csvstring
Download file in JSON or CSV format
Valid values:
false: JSON (default)true: CSV
Example request :
curl -X GET "manage.zadarastorage.com/api/v2/organizations/1a2b..36.char.UUID.string..x9z/cost_explorer/details.json" \
   -H "accept: application/json" \
   -H "X-Token: A1b2..token.string..yz" \
   --get --data-urlencode "granularity=monthly" \
         --data-urlencode "from=2025-03-01" \
         --data-urlencode "to=2025-05-12" \
         --data-urlencode "download_csv=false"
         --data-urlencode "billable_type[]=elastic_ip" \
         --data-urlencode "billable_type[]=volume"
Response example, displaying 2 of the
total_countof rows returned:Note
When
metadatais returned in the response with the value"estimation": true, it indicates a temporary calculated Estimation in place of unpopulated values for the row.{ "status": "success", "total_count": 936, "data": [ { "id": 3309950, "report_date": "2025-03-30", "org_id": "myOrg1", "parent_org": "myParentOrg1", "cloud": "myCloud1", "cloud_id": "4da21e44-66d4-4b1c-b8c3-abcdefgh1234", "customer": "", "resource_type": "Elastic IP", "resource_id": "c5a62293-1896-4778-9e34-abcdefgh1234", "resource_name": "172.221.32.11", "billable_type": "elastic_ip", "item": "Elastic IP - No Charge", "item_description": "Elastic IP - No Charge", "resource_created_at": "2024-11-08T15:53:33.000Z", "resource_deleted_at": null, "resource_status": "active", "compute_account_id": "123493a10ee44da98549c5a65def5678", "compute_account_name": "myAccount1", "compute_project_id": "1234454c6e294b5bacd5eb96f2155678", "compute_project_name": "myProj1", "compute_user_id": "", "compute_user_name": "", "vm_cpus": null, "vm_ram": null, "volume_disk_size": null, "vm_attached_to_uuid": "919f62b1-c189-4aa1-b421-abcdefgh1234", "service_type": "", "compute_instance_type": "", "compute_instance_type_aws_alias": "", "unit_price": "0.0", "discount": "0.0", "quantity_mtd": 906, "quantity_est": 672, "hours_mtd": 906, "hours_est": 672, "gross_amount_mtd": "0.0", "gross_amount_est": "0.0", "net_amount_mtd": "13573000.0", "net_amount_est": "0.0", "image_source": "", "billing_uuid": null, "created_at": "2025-03-31T15:49:02.119Z", "updated_at": "2025-03-31T15:49:02.119Z", "metadata": { "estimation": true } }, { "id": 3309951, "report_date": "2025-03-30", "org_id": "myOrg1", "parent_org": "myParentOrg1", "cloud": "myCloud1", "cloud_id": "4da21e44-66d4-4b1c-b8c3-abcdefgh1234", "customer": "", "resource_type": "Elastic IP", "resource_id": "a465b79b-c982-4858-99b8-abcdefgh1234", "resource_name": "172.221.32.110", "billable_type": "elastic_ip", "item": "Elastic IP - No Charge", "item_description": "Elastic IP - No Charge", "resource_created_at": "2023-09-09T13:38:40.000Z", "resource_deleted_at": null, "resource_status": "active", "compute_account_id": "12340e3ddbb843979d8c782cb3c05a3c", "compute_account_name": "myAccount99", "compute_project_id": "1234c1cee6fe4eb890c73a4fc51f5678", "compute_project_name": "myProj99", "compute_user_id": "", "compute_user_name": "", "vm_cpus": null, "vm_ram": null, "volume_disk_size": null, "vm_attached_to_uuid": "", "service_type": "", "compute_instance_type": "", "compute_instance_type_aws_alias": "", "unit_price": "0.0", "discount": "0.0", "quantity_mtd": 906, "quantity_est": 672, "hours_mtd": 906, "hours_est": 672, "gross_amount_mtd": "0.0", "gross_amount_est": "0.0", "net_amount_mtd": "13574000.0", "net_amount_est": "0.0", "image_source": "", "billing_uuid": null, "created_at": "2025-03-31T15:49:02.119Z", "updated_at": "2025-03-31T15:49:02.119Z", "metadata": { } } ] }
Drill-down detail table columns
Column Name |
Data Type |
Default |
Description |
|---|---|---|---|
Report Date |
date |
✓ |
Date when the usage data was recorded. |
Organization ID |
UUID |
Unique identifier for the organization. |
|
Parent Organization |
UUID |
Identifier for the parent organization, if applicable. |
|
Cloud |
string |
✓ |
Name of the cloud where the resource is hosted. |
Cloud ID |
UUID |
Unique identifier for the cloud. |
|
Customer |
string |
✓ |
Provisioning Portal username associated with the resource. |
Resource Type |
string |
✓ |
Resource family name (e.g. Object Storage, VPSA, VM, Volume) |
Resource ID |
UUID |
Unique identifier for the resource. |
|
Resource Name |
string |
Resource display name. |
|
Billable Type |
string |
Resource’s billing code. |
|
Item |
string |
✓ |
Specific item or service being billed. |
Item Description |
string |
Description of the billed item or service. |
|
Resource Created At |
timestamp |
UTC timestamp when the resource was created. |
|
Resource Deleted At |
timestamp |
UTC timestamp when the resource was deleted, if applicable. |
|
Resource Status |
string |
Current status of the resource (e.g., active, deleted). |
|
Compute Account ID |
UUID |
Unique identifier for the zCompute account. |
|
Compute Account Name |
string |
✓ |
zCompute account display name. |
Compute Project ID |
UUID |
Unique identifier for the zCompute project. |
|
Compute Project Name |
string |
zCompute project display name. |
|
Compute User ID |
UUID |
Unique identifier for the zCompute user. |
|
Compute User Name |
string |
zCompute username. |
|
VM CPUs |
integer |
Number of virtual CPUs allocated to the VM. |
|
VM RAM |
integer |
Amount of RAM allocated to the VM, in GiB. |
|
Volume Disk Size |
integer |
zCompute EBS Disk Size (GB). |
|
VM Attached To UUID |
UUID |
UUID of the VM to which the volume is attached. |
|
Service Type |
string |
Type of service provided (e.g., compute, storage). |
|
Compute Instance Type |
string |
zCompute instance type. |
|
Compute Instance Type AWS Alias |
string |
AWS-equivalent instance type alias. |
|
Unit Price |
decimal |
✓ |
Price per unit of the billed item. |
Discount |
decimal |
✓ |
Discount percentage applied to the unit price, if any. |
Quantity MTD |
integer |
Quantity of units used month-to-date. |
|
Quantity EST |
integer |
Estimated quantity to be used until the end of the month. |
|
Hours MTD |
integer |
Number of hours since the beginning of the month. |
|
Hours EST |
integer |
Estimated number of hours in the current billing cycle. |
|
Gross Amount MTD |
decimal |
Gross amount month-to-date (Price * Qty Units * Hours). |
|
Gross Amount EST |
decimal |
Estimated gross bill amount (Price * Est Qty * Est Hours). |
|
Net Amount MTD |
decimal |
Net month-to-date billable amount after discounts. |
|
Net Amount EST |
decimal |
Estimated net amount to be billed after discounts. |
|
Image Source |
UUID |
UUID of zCompute image source used for the VM. |
|
Billing UUID |
UUID |
✓ |
Unique identifier for the billing record. |
When daily granularity is selected, daily reports also include the following columns in the drill-down view:
Column Name |
Data Type |
Default |
Description |
|---|---|---|---|
Daily Quantity |
integer |
✓ |
Calculated: Yesterday’s Qty MTD subtracted from Today’s Qty MTD. |
Daily Hours |
integer |
✓ |
Calculated: Yesterday’s Hours MTD subtracted from Today’s Hours MTD. |
Daily Gross Amount |
decimal |
✓ |
Calculated: Yesterday’s Gross Amount MTD subtracted from Today’s Gross Amount MTD. |
Daily Net Amount |
decimal |
✓ |
Calculated: Yesterday’s Net Amount MTD subtracted from Today’s Net Amount MTD. |